April 15, 2011 / 60(14);447
* Per 100,000 U.S. standard population.
† Data for 2008 are preliminary.
In 2008, the overall age-adjusted death rate in the United States was 758.7 per 100,000 population. Among states, the rate ranged from 589.0 deaths per 100,000 population in Hawaii to 958.5 in West Virginia. In general, death rates were higher among states in the South and lower among states in the Northeast and West census regions.
Source: MiniƱo AM, Xu JQ, Kochanek KD. Deaths: preliminary data for 2008. Natl Vital Stat Rep 2010;59(2).
This blog tracks aging and disability news. Legislative information is provided via GovTrack.us.
In the right sidebar and at the page bottom, bills in the categories of Aging, Disability, Medicare, Medicaid, and Social Security are tracked.
Clicking on the bill title will connect to GovTrack updated bill status.
Showing posts with label data. Show all posts
Friday, April 15, 2011
Thursday, February 17, 2011
New Data on CHIPRA, Medical Malpractice, Childhood Obesity Laws, HCBS, State Budgets, and More
Statehealthfacts.org has recently added new and updated data on Demographics & the Economy, Health Status, Medicaid & CHIP, Medicare, Providers & Service Use, Minority Health, HIV/AIDS, and Health Reform. You can also view a list of all recent updates.
Demographics & the Economy
Statehealthfacts.org is a Kaiser Family Foundation website.
Demographics & the Economy
- State Fiscal Distress
Measures of aggregate state rankings in foreclosures, unemployment, and food stamp participation have been updated with the latest information from RealtyTrac, the United States Department of Agriculture (USDA), and the Bureau of Labor Statistics (BLS). Updated data on states with projected budget shortfalls for state fiscal year (SFY) 2012 have been added from the Center on Budget and Policy Priorities (CBPP). - State Budgets
The latest state-by-state information from the National Association of State Budget Officers (NASBO) on total state expenditures, per capita state spending, and the distribution of general fund spending is available for SFY2009.
- State or Federal Inmates
Updated data from the Bureau of Justice Statistics on the number of adult prisoners under state jurisdiction, adult prisoners by gender, and the incarceration rate per 100,000 population have been added for all states and the nation for 2009. - Union Employees
Information on the number of workers represented by unions has been updated for 2010 based on data from the BLS. - Cigarette Excise Tax
The most recent data from the American Lung Association on state cigarette excise taxes are available for 2010.
- Childhood Obesity and Firearm Safety
The latest data on state laws addressing childhood obesity and states with firearm laws designed to protect children are now available for 2010 from the American Academy of Pediatrics’ State Legislation Report. - Public Place Smoking Bans
Updated information on states with public place smoking bans has been added for all states from the American Nonsmokers’ Rights Foundation for 2011.
- Medicaid and CHIP Eligibility

New data from the Kaiser Commission on Medicaid and the Uninsured (KCMU) and the Georgetown University Center for Children and Families on CHIP program type and children’s upper income eligibility limit for Medicaid/CHIP have been added as of January 2011. - Co-Payments and Premiums for Children in Medicaid/CHIP

Also new from KCMU and Georgetown University is information on premium and co-payment amounts and requirements as of January 2011.
- Children’s Health Insurance Program Reauthorization Act (CHIPRA)
New data on state adoption of coverage and enrollment options in CHIPRA have been added for all states and the nation as of January 2011 from KCMU and Georgetown University. Also new are data on CHIPRA performance bonus awards for FY2009 and FY2010 from InsureKidsNow.gov. - Home and Community-Based Services (HCBS)
Updated data from KCMU and University of California at San Francisco analysis of CMS Form 372 are now available for all states and the nation for 2007. Updated topics include total HCBS waivers, expenditures by waiver type, aged/disabled participants, home health participants, and personal care expenditures. - State Medicaid Spending
The latest information from NASBO on the distribution of state Medicaid spending has been added for all states and the nation for SFY2009.
- Medicare Drug Benefit
The latest data on Medicare beneficiaries with prescription drug coverage and low-income subsidy eligible beneficiaries with Medicare prescription drug coverage have been added from the Centers for Medicare and Medicare Services (CMS) as of February 2010. - Medicare Prescription Drug Plans (PDPs)
Updated data from Mathematica Policy Research and Kaiser Family Foundation (KFF) analysis of the CMS Prescription Drug Landscape File on the number of Medicare PDPs, PDPs with no deductible, and PDPs with no coverage in the benefit gap are available for all states and the nation for 2011.
- Medicare Advantage
Data on the number of Medicare Advantage contracts and Medicare special needs plan (SNP) offerings have been updated for 2011 from KFF analysis of CMS Landscape Source files. - Medicare Service Use
The most recent information on Medicare service use, including short-stay hospitals, skilled nursing facilities, and home health services, has been added from CMS for 2009.
- Medical Malpractice
Updated data from KFF analysis of the National Practitioner Data Bank Public Use Data File on the number of paid medical malpractice claims, total dollars in paid claims, and average claims payments are now available for all states and the nation for 2009. - Medical School Graduates
The latest information on the number of medical school graduates and medical school graduates by gender has been added from the Association of American Medical Colleges for 2010. Data from 2002 through 2010 are available for trend analysis.
- Medical School Graduates
Also updated from the Association of American Medical Colleges are state-by-state data on medical school graduates by race/ethnicity and Hispanic ethnicity.
- Syringe Exchange Programs
The most recent information from the North American Syringe Exchange Network on states with sterile syringe exchange programs has been added for 2011.
- Federal Lawsuit
Updated information on states that have joined the federal lawsuit against the Affordable Care Act is now available from the National Council of State Legislatures for 2011.
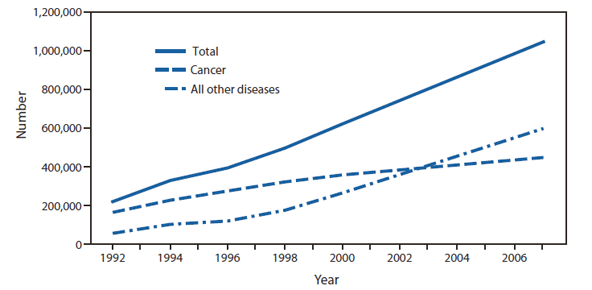
QuickStats: Annual Number of Patients Discharged from Hospice Care, by Primary Diagnosis (Cancer Versus All Other Diseases)* --- United States, National Home and Hospice Care Survey, 1992--2007
Morbidity and Mortality Weekly Report (MMWR)
* Primary diagnosis is assessed on admission for hospice-care services. Estimates are based on the number of discharged patients, the majority of whom leave hospice care at death. Some patients might discontinue care while living, some might reenter care, and some might have more than one episode of care in a 12-month period.
The figure above shows the annual number of patients discharged from hospice care, by primary diagnosis (cancer versus all other diseases) in the United States during 1992-2007. Use of hospice care increased from approximately 219,300 discharged hospice-care patients in 1992 to 1,045,100 in 2007. In 1992, three out of four patients (approximately 163,600) had a primary diagnosis of cancer, compared with 55,500 patients with all other diseases. In 2007, less than half of patients (42%) had a primary diagnosis of cancer, for a total of 447,600 cancer patients, compared with 597,500 patients with all other diseases.
Source: CDC. National Home and Hospice Care Survey data, 1992, 1994, 1996, 1998, 2000, 2002, 2004, and 2007. Additional information available at http://www.cdc.gov/nchs/nhhcs.htm.
Thursday, February 3, 2011
Record number of pensioners still working | CARDI : Centre for Ageing Research and Development in Ireland
By Harry Wallop, Consumer Affairs Editor, The Telegraph - United Kingdom
A record number of people are still working beyond the age or retirement, according to official statistics, which suggested the recession has forced people to work far longer than they used to.
Nearly one in every eight men – or 11.7 per cent – of men aged 65 or over, and 12.3 per cent of women aged 60 or over are still working, according to the Office for National statistics.
The figures suggest that thousands of pensioners are going back to work to fund their slim incomes, or that they are not in a financially strong enough position to retire in the first place. Some are also actively choosing to work longer, because of better health and a desire to keep active.
They are the latest data to demonstrate how the recession has changed the face of Britain's workforce, leading to far more part-time workers and older workers, while leaving many more young people out of work.
The ONS figures also showed that the average age of retirement has significantly increased in recent years and hit a new record. The average age for men was 64.7 years during 2010, up from 63 in 1996. Women left the workplace when they were 62.5 years old, on average – a full two years after the official retirement age, and up from 60.6 in 1996.
Full Article
A record number of people are still working beyond the age or retirement, according to official statistics, which suggested the recession has forced people to work far longer than they used to.
Nearly one in every eight men – or 11.7 per cent – of men aged 65 or over, and 12.3 per cent of women aged 60 or over are still working, according to the Office for National statistics.
These are the highest rates since records began and compare against rates of between 7 or 8 per cent throughout the 1990s.
The figures suggest that thousands of pensioners are going back to work to fund their slim incomes, or that they are not in a financially strong enough position to retire in the first place. Some are also actively choosing to work longer, because of better health and a desire to keep active.
They are the latest data to demonstrate how the recession has changed the face of Britain's workforce, leading to far more part-time workers and older workers, while leaving many more young people out of work.
The ONS figures also showed that the average age of retirement has significantly increased in recent years and hit a new record. The average age for men was 64.7 years during 2010, up from 63 in 1996. Women left the workplace when they were 62.5 years old, on average – a full two years after the official retirement age, and up from 60.6 in 1996.
Full Article
Sunday, October 10, 2010
Current Depression Among Adults --- United States, 2006 and 2008
Depressive disorders are more common among persons with chronic conditions (e.g., obesity, cardiovascular disease, diabetes, asthma, arthritis, and cancer) and among those with unhealthy behaviors (e.g., smoking, physical inactivity, and binge drinking.
To estimate the prevalence of current depression, CDC analyzed Behavioral Risk Factor Surveillance System (BRFSS) survey data from 2006 and 2008. Current depression was defined as meeting BRFSS criteria for either major depression or "other depression" during the 2 weeks preceding the survey.
This report summarizes the results of that analysis, which indicated that, among 235,067 adults (in 45 states, the District of Columbia [DC], Puerto Rico, and the U.S. Virgin Islands), 9.0% met the criteria for current depression, including 3.4% who met the criteria for major depression.
By state, age-standardized estimates for current depression ranged from 4.8% in North Dakota to 14.8% in Mississippi. State health departments that include depression measures in their BRFSS surveys can track prevalence, set health goals for prevention and control, and monitor the effectiveness of relevant programs and policies.
Full Article
Monday, September 20, 2010
New Poverty Data
In response to the new Census data on poverty, income and health insurance coverage, Spotlight on Poverty and Opportunity
has compiled a variety of resources to help journalists, policymakers
and advocates locate timely analysis, statements and events examining
the new figures. We’ve also provided tools for you to share in
discussions about the new poverty data:
- Resource guide: includes a listing of events, blog postings, reports and analysis. The guide will be continuously updated with new resources as they become available.
- Twitter campaign: help highlight the importance of the new Census Bureau figures and raise awareness of poverty in the United States by tweeting about the new data using the #poverty hashtag
- Exclusive commentary: Caroline Ratcliffe and Signe-Mary McKernan of the Urban Institute authored an exclusive commentary for Spotlight, “Help Children Born into Poverty”
- Idea Generator: in collaboration with Spotlight, American Radio Works launched the Reducing Poverty Idea Generator, an online platform for exchanging ideas about how to help low-income Americans achieve financial security. Post your ideas about how to reduce poverty in the United States.
Spotlight
on Poverty and Opportunity is an initiative of the AARP Foundation,
the Annie E. Casey Foundation, The Atlantic Philanthropies, the Bill & Melinda Gates Foundation,
The California Endowment, the Eos Foundation, the Endowment for Health (New Hampshire),
the Ford Foundation, the Foundation for the Mid South, The George Gund Foundation,
the Hagedorn Foundation, Living Cities, the Louisiana Disaster Recovery Foundation,
the Northwest Area Foundation, the Open Society Institute, the Public Welfare Foundation,
the Robert Wood Johnson Foundation, Rosenberg Foundation, the Sisters of Charity Foundation of South Carolina, the Stoneman Family Foundation, the Women's Funding Network and other major national
foundations. The Kaiser Family Foundation provides in-kind television and web cast facilities.
the Annie E. Casey Foundation, The Atlantic Philanthropies, the Bill & Melinda Gates Foundation,
The California Endowment, the Eos Foundation, the Endowment for Health (New Hampshire),
the Ford Foundation, the Foundation for the Mid South, The George Gund Foundation,
the Hagedorn Foundation, Living Cities, the Louisiana Disaster Recovery Foundation,
the Northwest Area Foundation, the Open Society Institute, the Public Welfare Foundation,
the Robert Wood Johnson Foundation, Rosenberg Foundation, the Sisters of Charity Foundation of South Carolina, the Stoneman Family Foundation, the Women's Funding Network and other major national
foundations. The Kaiser Family Foundation provides in-kind television and web cast facilities.
Tuesday, August 10, 2010
NCOA Offers Two New Tools for Seniors in Need of Benefits
The National Council on Aging’s National Center for Benefits Outreach & Enrollment (NCBOE) has developed a new data mapping tool that allows users to search for information about eligibility and enrollment trends in Medicare and Medicaid benefits programs. The map also provides statistics on the number of individuals eligible for or enrolled in programs such as Medicare Part D Extra Help.
For guidance on how to navigate the map, please go to http://ssl4.benefitscheckup.org/datamap/
NCBOE also has published a new issue brief called Extra Help to Keep Extra Help: Assisting LIS Beneficiaries Who Lose Their Deemed Status. It offers promising strategies using list-driven communications to help beneficiaries adversely affected by the redeeming process regain and retain the Medicare Part D Low-Income Subsidy.
To download a copy of the http://www.centerforbenefits.org/NCBOE%20Issue%20Brief%206.pdf
To learn more about the National Council on Aging’s National Center for Benefits Outreach & Enrollment, please go to http://www.ncoa.org/
For guidance on how to navigate the map, please go to http://ssl4.benefitscheckup.org/datamap/
NCBOE also has published a new issue brief called Extra Help to Keep Extra Help: Assisting LIS Beneficiaries Who Lose Their Deemed Status. It offers promising strategies using list-driven communications to help beneficiaries adversely affected by the redeeming process regain and retain the Medicare Part D Low-Income Subsidy.
To download a copy of the http://www.centerforbenefits.org/NCBOE%20Issue%20Brief%206.pdf
To learn more about the National Council on Aging’s National Center for Benefits Outreach & Enrollment, please go to http://www.ncoa.org/
Thursday, August 5, 2010
New Data on Medicaid Enrollment and Costs, Medicaid Managed Care, Health Insurance Premiums, HMOs, and More
Medicaid & CHIP
Statehealthfacts.org is a Kaiser Family Foundation website.
|
Friday, July 2, 2010
Disability.gov: Countdown to the 20th Anniversary of the ADA: Day 25 - Disability Statistics
Image via WikipediaDid you know that a VERY important announcement is made the first Friday of EVERY month? It is publicized on virtually every news network and is often viewed as a major indicator of the status of the U.S. economy by politicians, researchers, economists and everyday citizens alike. It is the release of the nation’s unemployment rate - which, by the way, currently stands at 9.9 percent. It is released by the Bureau of Labor Statistics (BLS) and represents the most comprehensive measure of national employment and unemployment. These measures are obtained from a survey called the Current Population Survey (CPS), conducted monthly by the U.S. Census Bureau for the BLS.
Unfortunately, the CPS was not originally designed to capture whether or not the person being surveyed has a disability (although certain questions address the issue). However, since June 2008, the Census Bureau has asked six new questions, the purpose of which is to identify whether the person who is surveyed has a disability and the nature of the disability. The six survey questions are:
- Is {person} deaf or does {person} have serious difficulty hearing?
- Is {person} blind or does {person} have serious difficulty seeing even when wearing glasses
- Because of a physical, mental or emotional condition, does {person} have serious difficulty concentrating, remembering or making decisions?
- Does {person} have serious walking or climbing stairs?
- Does {person} have difficulty dressing or bathing?
- Because of a physical, mental or emotional condition, does {person} have difficulty doing errands alone such as visiting a doctor's office or shopping?
This information is vital for the disability community because it provides a primary source of data on employment status and characteristics of the labor force, emerging trends and changes in the employment rate of individuals with disabilities. What do the current numbers reveal? Well, according to the April 2010 CPS (not seasonally adjusted), the employment rate of the civilian noninstitutional population with disabilities, ages 16 to 64, was 28.9 percent compared to 70.0 percent for persons without disabilities. The unemployment rate for individuals with disabilities was 15.5. One of the most striking statistics involves the participation rate. Only 34.5 percent of individuals with disabilities ages 16 to 64 are participating in the labor force compared to 77.3 percent of persons with no disability!
Evaluating and researching this data will take time. But stay tuned! In addition, to the disability labor force status data released every month at http://www.bls.gov/news.release/empsit.t06.htm, a CPS supplement is currently being planned by the Department of Labor’s Office of Disability Employment Policy (ODEP) and BLS to delve further into disability employment data in order to better explain what these numbers really mean for people with disabilities and employers.
For More Information
To learn more about the CPS disability statistics, visit
http://www.bls.gov/cps/cpsdisability.htm. To find data from June 2008 through May 2010, visit http://www.bls.gov/webapps/legacy/cpsatab6.htm and select one or more questions from the data table on the page, then scroll down to click the "Retrieve data" button.
Tuesday, June 8, 2010
Canadian Residential Care Facilities Statistics
The term "residential care facilities" refers to facilities with four beds or more that are funded, licensed or approved by provincial/territorial departments of health and/or social services. This report focuses on homes for the aged, facilities for persons with mental disorders and other facilities which provide health or social care. Facilities for the aged include homes for the aged, nursing homes, lodges for senior citizens and rest homes. Certain facilities such as apartments or other homes for seniors not providing any level of care were not included. Facilities for persons with mental disorders include facilities for the psychiatrically disabled, developmentally delayed, emotionally-disturbed children and centres for those with drug/alcohol problems. Some psychiatric institutions are included here. Other residential care facilities include those for persons with physical disabilities, for delinquents, for transients and facilities that do not fit in any of the other categories.
History Note
The survey data were published unadjusted for non-response for the period from the 1984/1985 fiscal year to the 1993/1994 fiscal year. This new publication includes data adjusted for non-response for all fiscal years since 1984/1985, except 1994/1995 and 1995/1996, for which no publishable data are available. CANSIM data include correction for non-response for all years. To maintain comparability with published data, few changes were made in the historical data for the period from 1984/1985 to 1993/1994. However, a number of homes for the aged that had erroneously been included with residential care facilities in Alberta were removed from the data for all periods.
CANSIM data
Free access to the data is provided through a special CANSIM interface. The CANSIM tables can be linked directly from three different locations in the HTML product:
Tables section:
• Related CANSIM tables
• Individual tables, in the Source
Related products section:
• Selected CANSIM tables from Statistics Canada
History Note
The survey data were published unadjusted for non-response for the period from the 1984/1985 fiscal year to the 1993/1994 fiscal year. This new publication includes data adjusted for non-response for all fiscal years since 1984/1985, except 1994/1995 and 1995/1996, for which no publishable data are available. CANSIM data include correction for non-response for all years. To maintain comparability with published data, few changes were made in the historical data for the period from 1984/1985 to 1993/1994. However, a number of homes for the aged that had erroneously been included with residential care facilities in Alberta were removed from the data for all periods.
CANSIM data
Free access to the data is provided through a special CANSIM interface. The CANSIM tables can be linked directly from three different locations in the HTML product:
Tables section:
• Related CANSIM tables
• Individual tables, in the Source
Related products section:
• Selected CANSIM tables from Statistics Canada
Monday, March 22, 2010
CDC Study Examines Rising Incidence of TBI from MedPage Today
By Cole Petrochko, Staff Writer, MedPage Today
Traumatic brain injuries (TBIs) account for 1.7 million hospital visits and 52,000 deaths each year -- almost a third of the nation's injury-related fatalities, the CDC reported.
The agency's study found that the incidence rate of TBI-related emergency department visits and hospitalization increased by 14.4% and 19.5%, respectively, during the 2002-2006 survey period.
About 75% of those injuries were classified as concussions or other mild forms of TBI.
Its report, entitled "Traumatic Brain Injury in the United States: Emergency Department Visits, Hospitalizations, and Death," CDC found that TBIs tend to be concentrated among the young and old.
Continue Reading
Traumatic brain injuries (TBIs) account for 1.7 million hospital visits and 52,000 deaths each year -- almost a third of the nation's injury-related fatalities, the CDC reported.
The agency's study found that the incidence rate of TBI-related emergency department visits and hospitalization increased by 14.4% and 19.5%, respectively, during the 2002-2006 survey period.
About 75% of those injuries were classified as concussions or other mild forms of TBI.
Its report, entitled "Traumatic Brain Injury in the United States: Emergency Department Visits, Hospitalizations, and Death," CDC found that TBIs tend to be concentrated among the young and old.
Continue Reading
Related articles by Zemanta
- March is Brain Injury Awareness Month (prweb.com)
Tuesday, March 2, 2010
MetLife QuickFACTS - February Edition
Image via Wikipedia
Read/Download Newsletter
Friday, December 18, 2009
QuickStats: Percentage of Adults with Activity Limitations, by Age Group and Type of Limitation --- National Health Interview Survey, United States, 2008*
Wednesday, October 14, 2009
Daily Number: America’s Health Care is … Fairly Average - Pew Research Center
According to Americans the United States does not have the best health care in the world. Most see our health care as average (32%) or below average (27%) when compared with health care in other industrialized countries. Only 15% support the often-used political talking point that America has the best health care in the world; 23% say it is above average. Republicans (28%) are far more likely than Democrats (9%) or independents (12%) to say American health care is the best in the world, and conservative Republicans are even more pro American health care (66% say it is the best in the world or above average). More wealthy Americans are also more supportive of American health care. While 50% of those earning an income of $100,000 or more say American health care is above average or the best in the world, more than six-in-ten in the three income groups earning less than $75,000 say it is average or below average.
Continue Reading
Continue Reading
Friday, October 2, 2009
Indiana, Ohio link health exchanges ... American Medical News
As of September, two health information exchanges in Indiana and one in Ohio began exchanging data with each other.
The linkup among Indiana Health Information Exchange of Indianapolis, HealthLINC of Bloomington, Ind., and HealthBridge of Cincinnati marks what the networks say is the first time separate regional health information exchanges are sharing data. Federal officials and others hope to build a national health information network in this way, with regional networks linking up and sharing data.
Continue Reading
The linkup among Indiana Health Information Exchange of Indianapolis, HealthLINC of Bloomington, Ind., and HealthBridge of Cincinnati marks what the networks say is the first time separate regional health information exchanges are sharing data. Federal officials and others hope to build a national health information network in this way, with regional networks linking up and sharing data.
Continue Reading
Tuesday, September 29, 2009
U.S. poverty - UPI.com
Poverty rates grew substantially in eight states in 2008 under the weight of the worst economic conditions in the United States since the Great Depression.
Connecticut saw the largest increase with an additional 1.4 percent of the state's population living in poverty, the U.S. Census Bureau said.
Other states showing significant increases in their poverty percentages included California, Florida, Hawaii, Indiana, Michigan, Oregon and Pennsylvania.
Continue Reading
Connecticut saw the largest increase with an additional 1.4 percent of the state's population living in poverty, the U.S. Census Bureau said.
Other states showing significant increases in their poverty percentages included California, Florida, Hawaii, Indiana, Michigan, Oregon and Pennsylvania.
Continue Reading
U.S. income gap widens in recession - Stocks & economy- msnbc.com
Image via CrunchBase
The wealthiest 10 percent of Americans — those making more than $138,000 each year — earned 11.4 times the roughly $12,000 made by those living near or below the poverty line in 2008, according to newly released census figures. That ratio was an increase from 11.2 in 2007 and the previous high of 11.22 in 2003.
Household income declined across all groups, but at sharper percentage levels for middle-income and poor Americans. Median income fell last year from $52,163 to $50,303, wiping out a decade's worth of gains to hit the lowest level since 1997.
Continue Reading
Friday, September 25, 2009
Announcement: NHANES 50th Anniversary and Conference
NHANES has long been a primary source of data on the nation's health. NHANES findings were used to set the goals and track the progress in reducing cholesterol levels, the prevalence of high blood pressure, and the risks of blood lead exposure in the United States. NHANES documented the rise in obesity and diabetes and produced the first population-based estimates of human immunodeficiency virus infection and osteoporosis. NHANES data also are used for the growth charts by which pediatricians and parents check children's growth and development.
A hallmark of NHANES is its partnerships with other CDC programs, the National Institutes of Health, other U.S. Department of Health and Human Services programs, and other government agencies to collect data needed for public health policies and practice. Additional information about the NHANES 50th anniversary is available at http://www.cdc.gov/nchs/nhanes/nhanes50th.htm.
Read More
A hallmark of NHANES is its partnerships with other CDC programs, the National Institutes of Health, other U.S. Department of Health and Human Services programs, and other government agencies to collect data needed for public health policies and practice. Additional information about the NHANES 50th anniversary is available at http://www.cdc.gov/nchs/nhanes/nhanes50th.htm.
Read More
Thursday, September 17, 2009
The New Numbers - Health Insurance Reform Cannot Wait
Image via Wikipedia"These numbers only serve to further confirm a reality that far too many American families live with every day," said Secretary Sebelius. "Our health care system has reached a breaking point. The status quo is unsustainable, and continuing to delay reform is not an option."
The facts below underscore the urgency of health insurance reform.
* Nationwide, the number of uninsured has increased from 39.8 million in 2001 to 46.3 million in 2008.
* With the exception of Massachusetts - which enacted its own version of health insurance reform in 2006 - every state in the nation has seen its uninsured population grow or remain unacceptably high from 2001 to 2008. These numbers don't even include those who have lost their insurance in the recent recession or have had coverage gaps of shorter than a year.
* In nearly every state, private coverage is eroding with the percentage of people covered by employer-based coverage decreasing.
* The new numbers also drive home the frightening reality that losing health insurance could happen to any of us.
* Across the nation, more and more working Americans are uninsured, left without protection from health care costs.
* Even among high-income households, the ranks of the uninsured are rapidly growing.
"In states across the country, we've seen the health care coverage situation go from bad to worse," Secretary Sebelius added. "And it's clear that losing insurance isn't a problem that plagues only the poor or the unemployed - it could happen to anyone."
To learn more and view state by state data, visit http://www.healthreform.gov/healthcarestatus.html.
Subscribe to:
Posts (Atom)


![Reblog this post [with Zemanta]](http://img.zemanta.com/reblog_b.png?x-id=6d6b9977-7dc5-43f6-8f0f-049e44d132aa)

![Reblog this post [with Zemanta]](http://img.zemanta.com/reblog_b.png?x-id=d007062d-7cce-4cbe-be82-345af9704fed)
![Reblog this post [with Zemanta]](http://img.zemanta.com/reblog_b.png?x-id=76f918cc-2201-4f8e-8539-abae4f5d78c5)

![Reblog this post [with Zemanta]](http://img.zemanta.com/reblog_b.png?x-id=18146b45-cfb1-4e48-bd63-91721d8ddd83)
![Reblog this post [with Zemanta]](http://img.zemanta.com/reblog_b.png?x-id=732ec4b3-381c-426f-ae7d-4708022081c5)
![Reblog this post [with Zemanta]](http://img.zemanta.com/reblog_b.png?x-id=f918834a-fdf3-48d3-9d5c-70d012905251)

![Reblog this post [with Zemanta]](http://img.zemanta.com/reblog_b.png?x-id=b2e25a95-6b6d-4bf6-8261-6b768c103557)
![Reblog this post [with Zemanta]](http://img.zemanta.com/reblog_b.png?x-id=cafc861a-ceac-4a9b-b101-a0a4603be5b1)