Showing posts with label CDC. Show all posts

Friday, April 15, 2011

QuickStats: Age-Adjusted Death Rates* --- United States, 2008

April 15, 2011 / 60(14);447


* Per 100,000 U.S. standard population.

† Data for 2008 are preliminary.

In 2008, the overall age-adjusted death rate in the United States was 758.7 per 100,000 population. Among states, the rate ranged from 589.0 deaths per 100,000 population in Hawaii to 958.5 in West Virginia. In general, death rates were higher among states in the South and lower among states in the Northeast and West census regions.

Source: MiniƱo AM, Xu JQ, Kochanek KD. Deaths: preliminary data for 2008. Natl Vital Stat Rep 2010;59(2).

Sunday, April 3, 2011

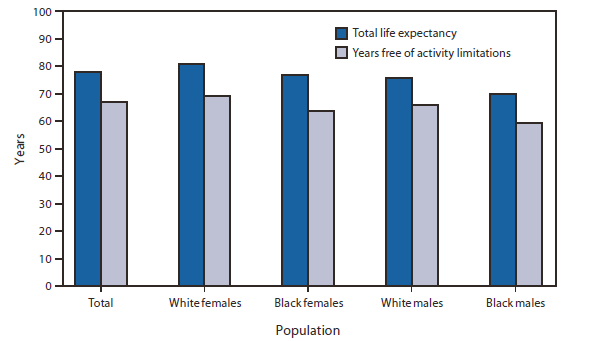
QuickStats: Life Expectancy and Years Free of Activity Limitations,* by Race and Sex --- United States, 2006


The figure shows the life expectancy and years free of activity limitations, by race and sex in the United States in 2006. In 2006, total life expectancy was greater for females than males and for whites than for blacks. Total life expectancy ranged from 80.6 years for white females and 76.5 years for black females to 75.7 years for white males and 69.5 years for black males. Expected years free of activity limitations was greatest for white females (69.1 years), followed by white males (65.7 years), black females (63.4 years), and black males (59.3 years).
* Estimates are based on data from the National Vital Statistics System and the National Health Interview Survey (NHIS). NHIS collects information in household interviews of a sample of the civilian noninstitutionalized U.S. population. Expected years free from activity limitations combines estimates of total life expectancy and prevalence rates of activity limitations associated with chronic conditions, which are determined from responses to several questions in the NHIS Family Core component. Questions and methods used to compute total life expectancy and expected years free of activity limitations are included in the source report.
In 2006, total life expectancy was greater for females than males and for whites than for blacks. Total life expectancy ranged from 80.6 years for white females and 76.5 years for black females to 75.7 years for white males and 69.5 years for black males. Expected years free of activity limitations was greatest for white females (69.1 years), followed by white males (65.7 years), black females (63.4 years), and black males (59.3 years).
Source: Molla MT, Madans JH. Life expectancy free of chronic condition-induced activity limitations among white and black Americans, 2000--2006. National Center for Health Statistics. Vital Health Stat 2010;3(34). Available at http://www.cdc.gov/nchs/data/series/sr_03/sr03_034.pdf Adobe PDF file.

Tuesday, March 22, 2011

The Impact of Trauma on Wellness: Implications for Comprehensive Systems Change


The Impact of Trauma on Wellness: Implications for Comprehensive Systems Change

March 30, 2011  |  3 to 4:30 p.m. Eastern Time
Search Now
SAMHSA invites you to a free training teleconference titled, "The Impact of Trauma on Wellness: Implications for Comprehensive Systems Change."

According to the Centers for Disease Control and Prevention, almost 60 percent of American adults say they endured abuse and other difficult family situations as children, otherwise known as adverse childhood experiences. Those experiences can have long-term health consequences and can create financial burdens on society due to the need for hospitalization, mental health care, child welfare services and/or law enforcement.

This teleconference will educate diverse stakeholders about comprehensive systems change, including preventing both harm and inadvertent retraumatization and ensuring that services and supports are welcoming, engaging, and culturally attuned. The goal is to help facilitate the healing process among people who have experienced trauma so that they can become fully engaged in their communities.

Presenters:
  • Cathy Cave, Senior Program Associate, Advocates for Human Potential
  • Roger Fallot, Ph.D., Director of Research and Evaluation, Community Connections
  • Ann Jennings, Ph.D., Founder and Executive Director, The Anna Institute
Register Now
Registration will close at 5 p.m. Eastern Time on Sunday, March 27, 2011.

Tuesday, March 15, 2011

Older Adults Not Getting Recommended Preventive Services

Critical gaps exist between older Americans who receive potentially lifesaving preventive services and those who do not, according to a new report from agencies of the U.S. Department of Health and Human Services.

Clinical prevention services examined in the report include vaccinations that protect against influenza and pneumococcal disease (e.g., bloodstream infections, meningitis, and pneumonia), screenings for the early detection of breast cancer, colorectal cancer, diabetes, lipid disorders, and osteoporosis, and smoking cessation counseling.

The report was published by the Centers for Disease Control and Prevention, in partnership with HHS' Administration on Aging, Agency for Healthcare Research and Quality, and Centers for Medicare and Medicaid Services.

The document, "Enhancing Use of Clinical Preventive Services Among Older Adults: Closing the Gap," highlights the need to promote preventive services for adults age 65 and older, especially among minorities.

"Millions of Americans are not getting proven clinical preventive services that we know can prevent disease and improve quality of life," said Lynda Anderson, Ph.D., director of the Healthy Aging Program at CDC and one of the primary authors. "The report takes stock of current levels of recommended services by older adults, and it becomes obvious that many of these services are woefully underutilized."

About 10,000 Americans turn 65 every day; by 2030, about 1 in 5 Americans will be 65 older.

"We know prevention is critical to healthy living and independence," said Kathy Greenlee, assistant secretary for aging. "It is important that we continue our efforts at the community level to reach all older Americans. We want to ensure that they are aware of the preventive benefits which are available to them, including those made possible by the Affordable Care Act."

The report also addresses the use of preventive services by diverse populations. It says 49 percent of Asian/Pacific Islanders and 47 percent of Hispanics reported not being screened for colorectal cancer, in comparison to 34 percent of whites. More than 50 percent of Hispanics, 47 percent of blacks and Asian/Pacific Islanders, and 36 percent of whites report never receiving a pneumococcal vaccination.

According to the report, challenges underlying these disparities are complex and reach beyond the traditional health care arena of patient-provider interactions. Older adults may not be aware of the services recommended for their age group or may not know that the services are covered by Medicare, the report said.

"The section of the report titled `Making a Difference' features innovative strategies applied at the local, state, and national levels to increase the use of preventive services in underserved communities," said Wayne Giles, M.D., M.S., director, Division of Adult and Community Health at CDC. "By putting into practice effective community and clinical strategies, we can dramatically reduce the gaps highlighted in this report."

The showcased activities include: promotion of policies to increase community access, making services available in convenient community settings, such as providing influenza vaccinations at polling places on election days, and building awareness through media.

Non-federal organizations contributing to the report include AARP, American Medical Association, Association of State and Territorial Health Officials, Gerontological Society of America, National Association of Area Agencies on Aging, National Association of Chronic Disease Directors, National Association of County and City Health Officials, and National Association of States United for Aging and Disabilities.

"Giving Americans access to quality, proven preventive services in their communities is a crucial part of improving the health of Americans and lowering their health care costs in the long run," said AARP board member Catherine Georges, R.N., Ed.D.

Contributors to and supporters of this report agree that the use of such services should be a high priority of community and health systems alike. While the benefit of expanded insurance coverage is substantial, it is also important that older adults take advantage of preventive services on a regular basis to ensure good health.

"If we can help patients age 65 and older get the recommended preventive screenings and regular immunizations, we could significantly reduce unnecessary illness," said Edward Langston, M.D., an American Medical Association board member.

To view the full report and for more information about CDC′s health aging activities visit here.

Source:
U.S. Department of Health and Human Services

Friday, February 18, 2011

Deaths from Acute Hepatitis B Virus Infection Associated with Assisted Blood Glucose Monitoring in an Assisted-Living Facility

Logo of the Centers for Disease Control and Pr...Image via Wikipedia
February 18, 2011 / 60(06);182

Sharing of blood glucose monitoring equipment in assisted-living facilities has resulted in at least 16 outbreaks of hepatitis B virus (HBV) infection in the United States since 2004 (1,2). On October 12, 2010, the North Carolina Division of Public Health (NCDPH) and the Wayne County Health Department were notified by a local hospital of four residents of a single assisted-living facility with suspected acute HBV infection. NCDPH requested HBV testing of all persons who had resided in the facility during January 1--October 13, 2010, and defined an outbreak-associated case as either 1) positive hepatitis B surface antigen and core immunoglobulin M (IgM) results or 2) clinical evidence of acute hepatitis (jaundice or serum aminotransferase levels twice the upper limit of normal) with onset ≥6 weeks after admission to the facility. Records were reviewed for potential health-care--associated exposures and HBV-related risk factors. Infection control practices were assessed through observations and interviews with facility staff.

The investigation identified unsafe practices, including sharing of reusable fingerstick lancing devices approved for single patient use only and shared use of blood glucose meters without cleaning and disinfection between patients. Of 87 persons who had resided in the facility during the study period, 47 were excluded from analysis because of HBV immunity (20 persons), chronic infection (one person), or unknown HBV status (26 persons). Of the remaining 40, eight met the case definition. Of these, all were hospitalized, and six died from hepatitis complications. All eight were among the 15 residents whom facility staff had assisted with blood glucose monitoring; none of 25 residents who had not been assisted with blood glucose monitoring were infected.

Despite long-standing and recently expanded infection control recommendations (2,3), HBV transmission continues to occur through sharing of fingerstick lancing devices and other blood glucose monitoring equipment. These practices put residents at risk for severe illness and death. In accordance with NCDPH recommendations, the facility now uses individually assigned blood glucose meters and single-use, autodisabling fingerstick lancing devices. The facility also offered HBV vaccine to all susceptible residents. NCDPH and the state licensing agency issued a notification to all health-care providers and licensed health-care facilities statewide warning of the potential for HBV transmission through unsafe diabetes-care practices. This outbreak underscores the need for increased efforts to promote compliance with infection-control guidelines in assisted-living facilities.

Reported by


Z Moore, MD, J-M Maillard, MD, M Davies, MD, North Carolina Dept of Health and Human Svcs; N Dailey, MD, EIS Officer, CDC.

References

  1. CDC. Transmission of hepatitis B virus among persons undergoing blood glucose monitoring in long-term--care facilities---Mississippi, North Carolina, and Los Angeles County, California, 2003--2004. MMWR 2005;54;220--3.
  2. CDC. Infection prevention during blood glucose monitoring and insulin administration. Atlanta, GA: US Department of Health and Human Services, CDC; 2010; Available at http://www.cdc.gov/injectionsafety/blood-glucose-monitoring.html. Accessed February 10, 2011.
  3. Food and Drug Administration. Use of fingerstick devices on more than one person poses risk for transmitting bloodborne pathogens: initial communication: update 11/29/2010. Washington, DC: US Department of Health and Human Services, FDA; 2010; Available at http://www.fda.gov/medicaldevices/safety/alertsandnotices/ucm224025.htmExternal Web Site Icon. Accessed February 10, 2011.


Enhanced by Zemanta

Thursday, February 17, 2011

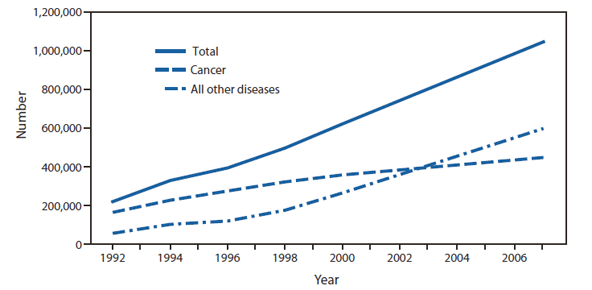
QuickStats: Annual Number of Patients Discharged from Hospice Care, by Primary Diagnosis (Cancer Versus All Other Diseases)* --- United States, National Home and Hospice Care Survey, 1992--2007

Logo of the Centers for Disease Control and Pr...Image via Wikipedia

Morbidity and Mortality Weekly Report (MMWR)


The figure shows the annual number of patients discharged from hospice care, by primary diagnosis (cancer versus all other diseases) in the United States during 1992-2007. Use of hospice care increased from approximately 219,300 discharged hospice-care patients in 1992 to 1,045,100 in 2007. In 1992, three out of four patients (approximately 163,600) had a primary diagnosis of cancer, compared with 55,500 patients with all other diseases. In 2007, less than half of patients (42%) had a primary diagnosis of cancer, for a total of 447,600 cancer patients, compared with 597,500 patients with all other diseases.
* Primary diagnosis is assessed on admission for hospice-care services. Estimates are based on the number of discharged patients, the majority of whom leave hospice care at death. Some patients might discontinue care while living, some might reenter care, and some might have more than one episode of care in a 12-month period.

The figure above shows the annual number of patients discharged from hospice care, by primary diagnosis (cancer versus all other diseases) in the United States during 1992-2007. Use of hospice care increased from approximately 219,300 discharged hospice-care patients in 1992 to 1,045,100 in 2007. In 1992, three out of four patients (approximately 163,600) had a primary diagnosis of cancer, compared with 55,500 patients with all other diseases. In 2007, less than half of patients (42%) had a primary diagnosis of cancer, for a total of 447,600 cancer patients, compared with 597,500 patients with all other diseases.

Source: CDC. National Home and Hospice Care Survey data, 1992, 1994, 1996, 1998, 2000, 2002, 2004, and 2007. Additional information available at http://www.cdc.gov/nchs/nhhcs.htm.

QuickStats: Annual Number of Patients Discharged from Hospice Care, by Primary Diagnosis (Cancer Versus All Other Diseases)* --- United States, National Home and Hospice Care Survey, 1992--2007
Enhanced by Zemanta

Saturday, January 29, 2011

QuickStats: Age-Adjusted Daily Kilocalorie Intake Among Adults Aged 20--74 Years, by Sex --- National Health and Nutrition Examination Survey, United States, 1971--2008*


The figure above shows age-adjusted daily kilocalorie intake among adults aged 20-74 years, by sex, in the United States, during 1971-2008. The average daily kilocalorie intake for men increased from the period 1971-1974 to 1988-1994 and then leveled off through 2007-2008. For women, the average daily kilocalorie intake increased from the period 1971-1974 to 1999-2000 and remained relatively stable through 2007-2008. Throughout the period 1971-1974 through 2007-2008, men consumed more kilocalorie on a daily basis than women. 
Enhanced by Zemanta

Wednesday, January 12, 2011

Most Seniors Don't Get Shingles Vaccination, CDC Finds

Although a vaccine to prevent shingles has been available since 2006, less than 7 percent of U.S. seniors - the demographic most frequently affected by the disease - chose to receive the vaccination as of 2008, finds a new study from the Centers for Disease Control and Prevention (CDC).

The vaccine reduces the risk of getting shingles by half and the risk of developing painful complications by two-thirds, according to Gary Euler, study co-author. Since the chance of contracting shingles increases with age and especially is high by age 80, when seniors are frail, he believes the value of the vaccine is incontestable.

Specifically, the vaccine protects against the herpes zoster virus, which causes chicken pox at first infection. The body never rids itself of the virus and it can show up again decades later as shingles. Symptoms include headache, fever and tingling or throbbing accompanied by jabs of stabbing pain called post-herpetic neuralgia (PHN), followed by a skin rash and blisters.

Up to 10 in every thousand seniors develop shingles every year. Without the vaccination, 10 percent to 14 percent of them will suffer from neuralgia.

In the new study appearing online and in the February 2011 issue of the American Journal of Preventive Medicine, researchers found that estimated coverage levels were low among all seniors and lowest among minority groups.

Source: Health Behavior News Service, part of the Center for Advancing Health

Full Article
Enhanced by Zemanta

Monday, January 10, 2011

End-of-Life Planning Common in Long-Term Care

By Crystal Phend, Senior Staff Writer, MedPage Today

Advance directives are common among long-term care residents, particularly those discharged from hospice, a CDC report found.

There was an advance directive on record for 28% of home healthcare patients, 65% of those at nursing homes, and 88% of hospice patients, according to an analysis of data from the 2004 National Nursing Home Survey and the 2007 National Home and Hospice Care Survey.

These rates compare very favorably with the 5% to 15% rate among adults overall in the U.S., Adrienne L. Jones, and colleagues at the CDC's National Center for Health Statistics in Hyattsville, Md., noted in the report.

But, they wrote, there's still room for improvement.

The most common forms of advance directives noted in the surveys were living wills and do-not-resuscitate orders.

The likelihood of having any type of advance directive appeared to differ by age and race or ethnicity.

Full Article
Enhanced by Zemanta

Sunday, October 24, 2010

QuickStats: Death Rates* For Persons Aged ≥65 Years, with Diabetes as the Underlying or a Contributing Cause, by Race and Sex --- United States, 1981--2007


* Rates are age-adjusted per 100,000 U.S. standard population aged ≥65 years. Cause of death is based on International Classification of Diseases, Ninth Revision (ICD-9) code 250 (Diabetes mellitus) for 1981--1998 and International Classification of Diseases, 10th Revision (ICD-10) codes E10--E14 (Diabetes mellitus) for 1999--2007.

Diabetes is a leading cause of death in the United States and a contributing cause of deaths from many other conditions. In 2007, diabetes was a contributing cause of death 2.4 times as often as it was the underlying cause of death for persons aged ≥65 years. Age-adjusted death rates for deaths with diabetes declined for white and black persons aged ≥65 years from 2005 to 2007, after generally increasing from 1981 to 2002. In 2007, the rate was higher for black men and women than for white men and women.

Sources: 
CDC. National Vital Statistics System. Available at http://www.cdc.gov/nchs/nvss.htm.
CDC. Health Data Interactive. Available at http://www.cdc.gov/nchs/hdi.htm.
 
Enhanced by Zemanta

Sunday, October 17, 2010

CDC - Seasonal Influenza (Flu) - Final Season Vaccination Estimates: United States, 2009-10 Influenza Season

Logo of the Centers for Disease Control and Pr...Image via WikipediaBecause the novel influenza A (H1N1) virus [2009 influenza A (H1N1)] was identified in April 2009, two separate influenza vaccines were distributed in the United States in 2009–2010: a seasonal vaccine and an influenza A (H1N1) 2009 monovalent vaccine (2009 H1N1 vaccine) [1, 2].

The final estimates in this report include vaccinations reported through May 2010 based on interviews through June 2010.

Key Finding:

Nationally, seasonal influenza vaccination coverage was highest among adults aged ≥65 years [69.6% (95% CI 69.0–70.2%)]. Among adults aged 50–64 years, national seasonal influenza vaccination coverage was 45.0% (95% CI 44.4–45.6%).

Seasonal Influenza Vaccination Coverage

  • National 2009–10 seasonal influenza vaccination coverage among all persons aged ≥6 months in the United States was 41.2% (95% confidence interval [CI] 40.8–41.6%).(Table 1)
  • Among children aged 6 months –17 years, national seasonal influenza vaccination coverage [43.7% (95% CI 42.8–44.6)] was higher than coverage for adults ≥18 years [40.4% (95% CI 40.0–40.8%)].
  • For adults aged 18–49 years, national seasonal influenza vaccination coverage was higher for persons with high–risk conditions [38.2% (95% CI 36.9–39.5%)] compared to those without high–risk conditions [28.4% (95% CI 27.8–29.0%)].
  • Nationally, seasonal influenza vaccination coverage was highest among adults aged ≥65 years [69.6% (95% CI 69.0–70.2%)]. Among adults aged 50–64 years, national seasonal influenza vaccination coverage was 45.0% (95% CI 44.4–45.6%).
  • For children aged 6 months –17 years, healthy adults aged 18–49 years, adults aged 18–49 years with high–risk conditions and adults aged ≥65 years, 2009–10 final estimates were higher than estimates for the same groups in the 2008–09 season [2008–09 estimates: 30.2% (95% CI 28.4–32.0%), 19.5% (95% CI 18.2–20.8%), 33.0% (95% CI 29.8–36.5%) and 65.6% (95% CI 63.3–67.8%) respectively; CDC, unpublished data, 2009 National Health Interview Survey (NHIS)].
  • One or more seasonal influenza vaccine doses were administered to 31.6 million (95% CI 30.9–32.3 million) children and 91.6 million (95% CI 90.7–92.5 million) adults, for an estimated 123.3 million (95% CI 122.1–124.5 million) seasonal influenza vaccinees during August 2009 through May 2010.
Full Article
Enhanced by Zemanta

Sunday, October 10, 2010

Current Depression Among Adults --- United States, 2006 and 2008

Logo of the Centers for Disease Control and Pr...Image via WikipediaMajor depression is a common and treatable mental disorder; a study conducted during 2001--2002 estimated that 6.6% of the U.S. adult population had experienced a major depressive disorder during the preceding 12 months.

Depressive disorders are more common among persons with chronic conditions (e.g., obesity, cardiovascular disease, diabetes, asthma, arthritis, and cancer) and among those with unhealthy behaviors (e.g., smoking, physical inactivity, and binge drinking.

To estimate the prevalence of current depression, CDC analyzed Behavioral Risk Factor Surveillance System (BRFSS) survey data from 2006 and 2008. Current depression was defined as meeting BRFSS criteria for either major depression or "other depression" during the 2 weeks preceding the survey.

This report summarizes the results of that analysis, which indicated that, among 235,067 adults (in 45 states, the District of Columbia [DC], Puerto Rico, and the U.S. Virgin Islands), 9.0% met the criteria for current depression, including 3.4% who met the criteria for major depression.

By state, age-standardized estimates for current depression ranged from 4.8% in North Dakota to 14.8% in Mississippi. State health departments that include depression measures in their BRFSS surveys can track prevalence, set health goals for prevention and control, and monitor the effectiveness of relevant programs and policies.
Full Article
Enhanced by Zemanta

QuickStats: Death Rates* for Five Leading Types of Cancer† --- United States, 1999--2007

The figure above shows the death rates for five leading types of cancer in the United States from 1999-2007. Age-adjusted death rates for lung, prostate, breast, and colon cancer declined during 1999-2007. The rate decreased by 9.6% for lung cancer, 23.9% for prostate cancer, 15.2% for breast cancer, and 19.6% for colon cancer. The death rate for pancreatic cancer did not change significantly during this period.
 
Full Report


Enhanced by Zemanta

Saturday, September 4, 2010

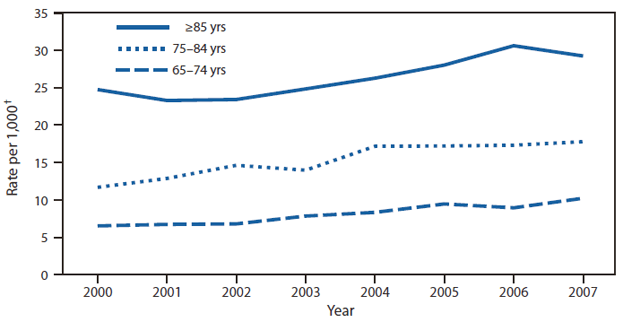
QuickStats: Hospitalization Rates for Patients Aged ≥65 Years with Septicemia or Sepsis,* by Age Group --- National Hospital Discharge Survey, United States, 2000--2007

September 3, 2010 / 59(34);1108
The figure shows hospitalization rates for patients aged ≥65 years with septicemia or sepsis, by Age Group, in the United States from 2000-2007. Results derived from the National Hospital Discharge Survey. Septicemia and sepsis are bloodstream infections. From 2000 to 2007, the rate of hospitalization for septicemia or sepsis for persons aged 65-74 years increased 57%, from 6.5 per 1,000 to 10.2, and the rate for persons aged 75-84 years increased 52%, from 11.7 to 17.8. During 2000-2007, persons aged ≥85 years had higher rates of hospitalization for septicemia or sepsis than persons aged 65-84 years. From 2000 to 2007, rates for persons aged ≥85 years increased 18% percent, from 24.7 per 1,000 to 29.2.
*Septicemia or sepsis hospitalizations are those with a diagnosis code of 038, 995.91, or 995.92, based on the International Classification of Diseases, Ninth Revision, Clinical Modification, in any of seven diagnoses fields of the National Hospital Discharge Survey.

† Inpatient hospitalization rates for 2000--2007 were calculated using U.S. Census Bureau 2000--based postcensal civilian population estimates. Persons might have multiple inpatient septicemia or sepsis hospitalizations, all of which are reflected in the estimates.

Septicemia and sepsis are bloodstream infections. From 2000 to 2007, the rate of hospitalization for septicemia or sepsis for persons aged 65--74 years increased 57%, from 6.5 per 1,000 to 10.2, and the rate for persons aged 75--84 years increased 52%, from 11.7 per 1,000 to 17.8. During 2000--2007, persons aged ≥85 years had higher rates of hospitalization for septicemia or sepsis than persons aged 65--84 years. From 2000 to 2007, rates for persons aged ≥85 years increased 18%, from 24.7 per 1,000 to 29.2.

SOURCE: National Hospital Discharge Survey, annual files, 2000--2007. Available at http://www.cdc.gov/nchs/nhds.htm.
Full Article
Enhanced by Zemanta

Updated Recommendations for Prevention of Invasive Pneumococcal Disease Among Adults Using the 23-Valent Pneumococcal Polysaccharide Vaccine (PPSV23)

Invasive disease from Streptococcus pneumoniae (pneumococcus) is a major cause of illness and death in the United States, with an estimated 43,500 cases and 5,000 deaths among persons of all ages in 2009 (1). This report provides updated recommendations from the Advisory Committee on Immunization Practices (ACIP) for prevention of invasive pneumococcal disease (IPD) (i.e., bacteremia, meningitis, or infection of other normally sterile sites [2]) through use of the 23-valent pneumococcal polysaccharide vaccine (PPSV23) among all adults aged ≥65 years and those adults aged 19--64 years with underlying medical conditions that put them at greater risk for serious pneumococcal infection. The new recommendations include the following changes from 1997 ACIP recommendations (2): 1) the indications for which PPSV23 vaccination is recommended now include smoking and asthma, and 2) routine use of PPSV23 is no longer recommended for Alaska Natives or American Indians aged <65>2). ACIP recommendations for prevention of pneumococcal disease among infants and youths aged ≤18 years using the 13-valent pneumococcal conjugate vaccine (PCV13) and PPSV23 are published separately (3).
Read Full Updated Recommendations
Enhanced by Zemanta

Sunday, August 29, 2010

Estimates of Deaths Associated with Seasonal Influenza --- United States, 1976--2007

Influenza infections are associated with thousands of deaths every year in the United States, with the majority of deaths from seasonal influenza occurring among adults aged ≥65 years (1--4). For several decades, CDC has made annual estimates of influenza-associated deaths, which have been used in influenza research and to develop influenza control and prevention policy. To update previously published estimates of the numbers and rates of influenza-associated deaths during 1976--2003 by adding four influenza seasons through 2006--07, CDC used statistical models with data from death certificate reports. National mortality data for two categories of underlying cause of death codes, pneumonia and influenza causes and respiratory and circulatory causes, were used in regression models to estimate lower and upper bounds for the number of influenza-associated deaths. Estimates by seasonal influenza virus type and subtype were examined to determine any association between virus type and subtype and the number of deaths in a season. This report summarizes the results of these analyses, which found that, during 1976--2007, estimates of annual influenza-associated deaths from respiratory and circulatory causes (including pneumonia and influenza causes) ranged from 3,349 in 1986--87 to 48,614 in 2003--04. The annual rate of influenza-associated death in the United States overall during this period ranged from 1.4 to 16.7 deaths per 100,000 persons. The findings also indicated the wide variation in the estimated number of deaths from season to season was closely related to the particular influenza virus types and subtypes in circulation.

The current study extends estimates of influenza-associated deaths from two previous CDC studies (2,3) by adding data from four more influenza seasons for a total of 31 influenza seasons (1976--2007). Estimates are provided for three age groups (<19>1) and can be considered a lower bound for deaths associated with influenza (2,4). However, a diagnosis of influenza virus infection often is not confirmed with sensitive and specific laboratory diagnostics, particularly among older persons, and even when identified is rarely recorded on death certificates (5). Many deaths associated with influenza infections occur from secondary infections such as bacterial pneumonia or complications of chronic conditions such as congestive heart failure and chronic obstructive pulmonary disease (6). Therefore, estimates using underlying respiratory and circulatory mortality data (which include pneumonia and influenza causes) can provide an upper bound for influenza-associated deaths (2,7).
Continue Reading
Enhanced by Zemanta

Thursday, August 26, 2010

Medical Jargon: A Barrier to Quality Care | Medicare Solutions Blog

Logo of the Centers for Disease Control and Pr...Image via WikipediaBy Lucy Dylan

The Center for Disease Control and other government officials are working to improve communication between doctors and patients. The Health Literacy Action Plan, a new government initiative, hopes to improve patients’ understanding of their health by simplifying medical language. According to the program’s web site, target groups include minorities and lower income individuals, two groups likely to lack basic health literacy.

One step health insurers have taken is to use a program that essentially translates medical jargon to plain English. The program, marketed by Health Literacy Innovations, scans a doctor’s document and suggests simplifications. Meanwhile, many state Medicaid programs have opted to provide health information written for people with fourth to sixth grade reading level, ensuring that people understand the medical treatments they need.
Read Full Article
Enhanced by Zemanta

Tuesday, July 13, 2010

Vital Signs: Colorectal Cancer Screening Among Adults Aged 50--75 Years --- United States, 2008

Logo of the Centers for Disease Control and Pr...Image via Wikipedia
Colorectal cancer (CRC) remains the second leading cause of cancer deaths in the United States and the leading cause of cancer deaths among nonsmokers. Statistical modeling indicates that, if current trends in health behaviors, screening, and treatment continue, U.S. residents can expect to see a 36% decrease in the CRC mortality rate by 2020, compared with 2000.

Continue Reading
Enhanced by Zemanta

Wednesday, July 7, 2010

Vital Signs: Colorectal Cancer Screening Among Adults Aged 50--75 Years --- United States, 2008

Logo of the Centers for Disease Control and Pr...
ABSTRACT  Background: Colorectal cancer (CRC) remains the second leading cause of cancer deaths in the United States and the leading cause of cancer deaths among nonsmokers. Statistical modeling indicates that, if current trends in health behaviors, screening, and treatment continue, U.S. residents can expect to see a 36% decrease in the CRC mortality rate by 2020, compared with 2000.

Methods: Every 2 years, CDC uses Behavioral Risk Factor Surveillance System data to estimate up-to-date CRC screening prevalence in the United States. Adults aged ≥50 years were considered to be up-to-date with CRC screening if they reported having a fecal occult blood test (FOBT) within the past year or lower endoscopy (i.e., sigmoidoscopy or colonoscopy) within the preceding 10 years. Prevalence was calculated for adults aged 50--75 years based on current U.S. Preventive Services Task Force recommendations.

Results: For 2008, the overall age-adjusted CRC screening prevalence for the United States was 62.9% among adult respondents aged 50--75 years, increased from 51.9% in 2002. Among the lowest screening prevalences were those reported by persons aged 50--59 years (53.9%), Hispanics (49.8%), persons with lower income (47.6%), those with less than a high school education (46.1%), and those without health insurance (35.6%).

Conclusions: CRC screening rates continue to increase in the United States. Underscreening persists for certain racial/ethnic groups, lower socioeconomic groups, and the uninsured.

Implications for Public Health Practice: Health reform is anticipated to reduce financial barriers to CRC screening, but many factors influence CRC screening. The public health and medical communities should use methods, including client and provider reminders, to ensure test completion and receipt of follow-up care. Public health surveillance should be expanded and communication efforts enhanced to help the public understand the benefits of CRC screening.
Read More
Enhanced by Zemanta

Vital Signs: Breast Cancer Screening Among Women Aged 50--74 Years --- United States, 2008

Logo of the Centers for Disease Control and Pr...Image via Wikipedia
Breast cancer remains the most commonly diagnosed cancer and the second leading cause of cancer deaths among women in the United States. In 2006 (the most recent data available), approximately 191,410 women were diagnosed with invasive breast cancer, and 40,820 women died (1). The incidence and mortality have been declining since 1996 at a rate of approximately 2% per year (2), possibly as a result of widespread screening with mammography and the development of more effective therapies (3). Mammography use declined slightly in 2004, but rose again in 2006 (4,5). This Vital Signs report updates mammography screening prevalence in the United States, using data from the 2008 Behavioral Risk Factor Surveillance System (BRFSS).
Read More
Enhanced by Zemanta